
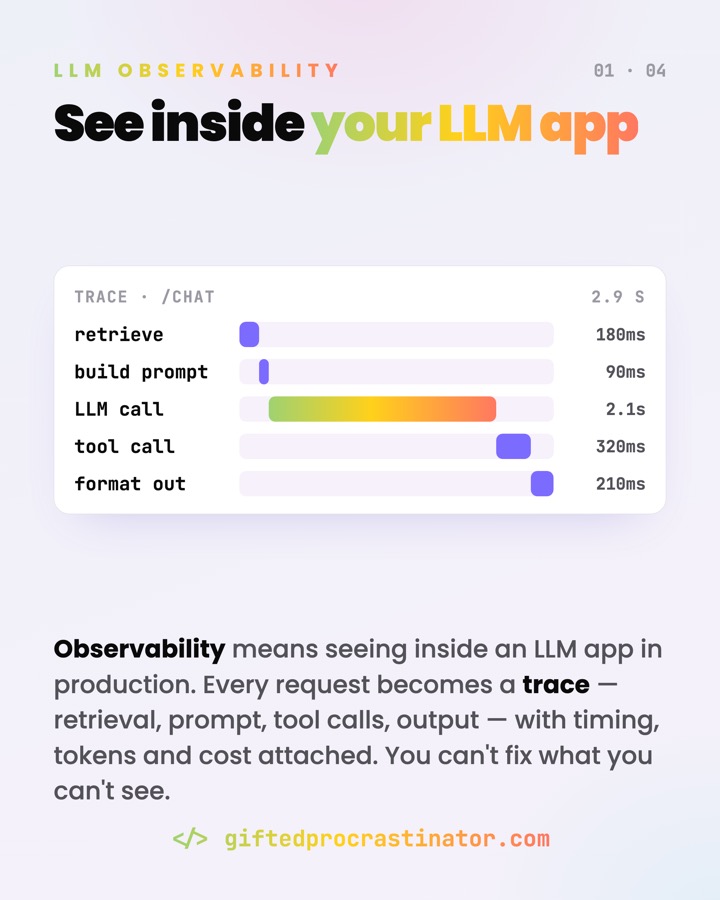
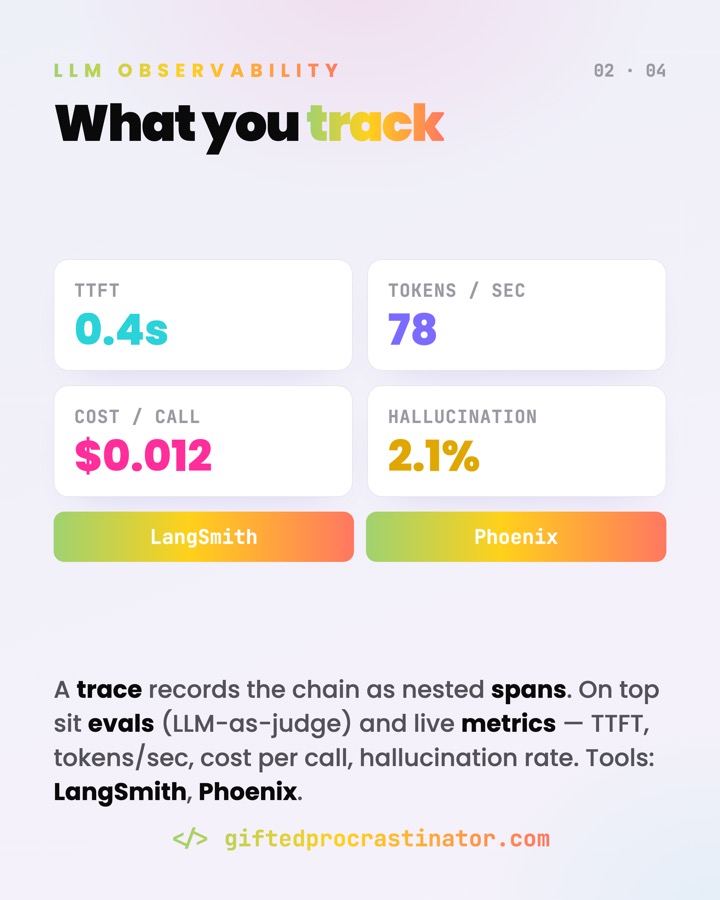
LLM observability is how you watch an LLM app once it's serving real users. Every request becomes a trace — retrieval, prompt, tool calls, model output — with timing, tokens and cost attached, plus quality scores on top. Classic APM tells you a request was fast; it can't tell you the answer was wrong.
Where you meet it
- RAG and agent apps: one user turn fans out into retrieval, several LLM calls and tool calls.
- The cost dashboard — token spend per call, per user, per feature.
- Eval pipelines that grade outputs in CI and on live traffic.
- Tools you'll see named: LangSmith, Langfuse, Phoenix — most built on OpenTelemetry.
What it does
It makes the inside of a non-deterministic system inspectable. You can pull up any single bad answer, replay the exact prompt and context that produced it, and see where in the chain time and money went — then aggregate that across millions of requests to spot trends and regressions.
Green latency and uptime tell you the system is fast — not that the answers are right. Only evals catch a quality regression.
How it works
You instrument every call in the pipeline. The unit is a span (one operation — a retrieval, an LLM call, a tool call); spans nest into a trace for the whole request. On each LLM span you log the model, the input messages and the output, and metrics like input/output tokens, cost, latency (often split into time-to-first-token and total) and error rate. OpenTelemetry's GenAI semantic conventions standardise the attribute names — gen_ai.request.model, gen_ai.usage.input_tokens and so on — so different tools speak the same language.
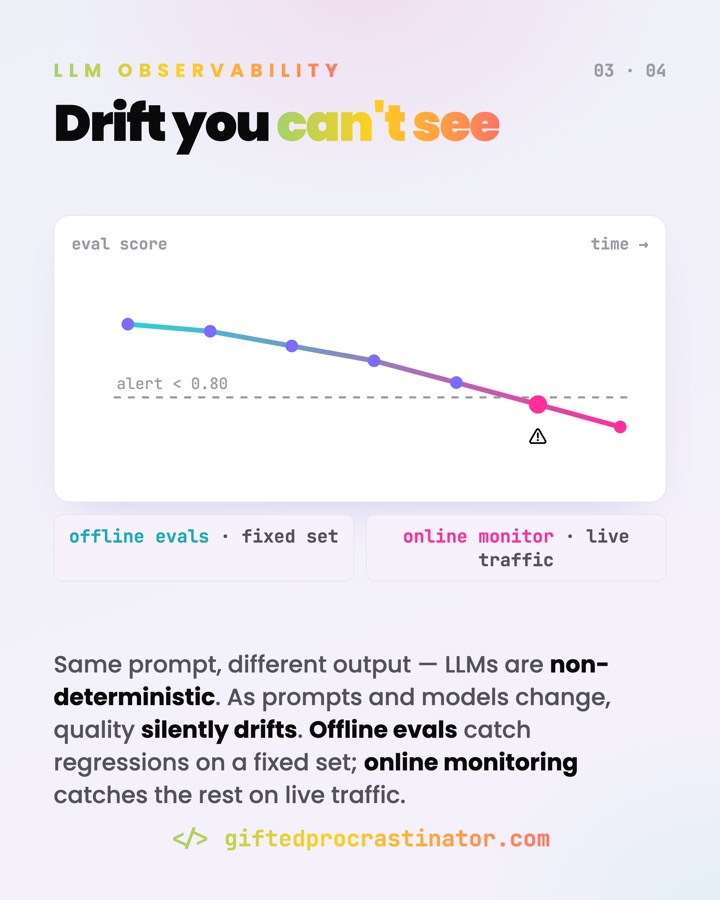
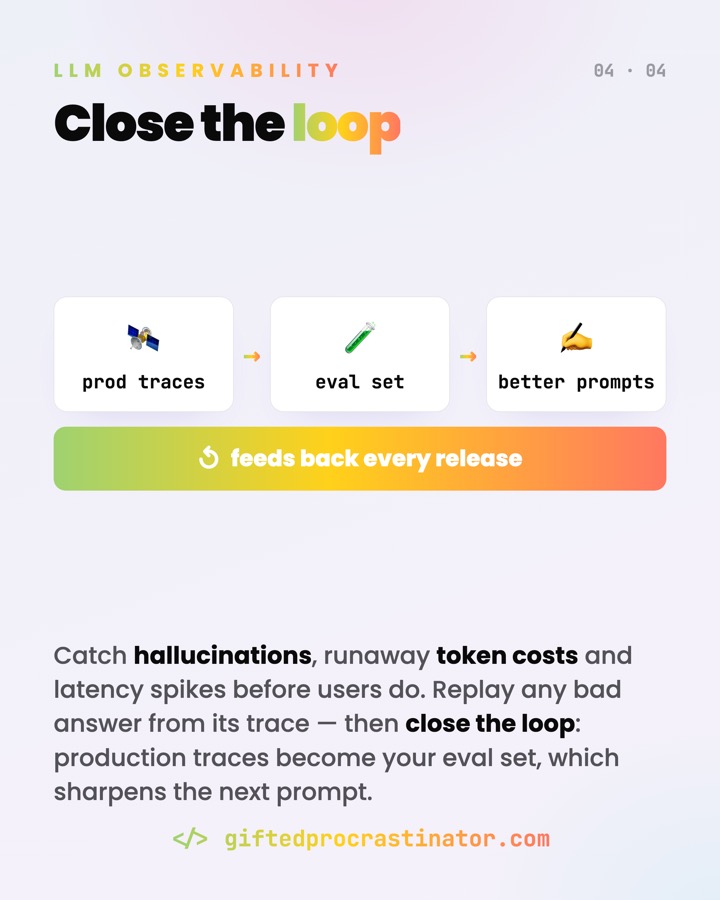
Because outputs are non-deterministic, timing and cost aren't enough — you also need quality. That comes from evals: offline evals run a fixed dataset against a new prompt or model before release; online evals score a sample of live traffic. Scores come from rules, an LLM-as-judge, or human review, and sit alongside explicit user feedback (thumbs up/down, edits, retries). The strong move is to close the loop: production traces become tomorrow's eval set, which sharpens the next prompt.
Watch out
- Prompts and outputs are user data. Logging them verbatim can capture PII or secrets — mask, redact or get consent before you store everything.
- "Looks fine" is a trap. Without evals, a quality regression is invisible until users complain; latency and uptime can be green while answers quietly rot.
- Sampling vs. logging everything. Full-fidelity capture is the most useful and the most expensive — decide what to sample, especially for online evals that re-call a model.
- Every model or prompt swap can regress. A "better" model may break a format your downstream code depends on — gate changes behind an offline eval.
- Define "good" before you measure. A judge or metric you can't defend gives you confident-looking noise.
Go deeper
LLM-Observability ist, wie man eine LLM-App beobachtet, sobald sie echte Nutzer bedient. Jede Anfrage wird zum Trace — Retrieval, Prompt, Tool-Calls, Modell-Output — mit Zeit, Tokens und Kosten dran, und Qualitäts-Scores obendrauf. Klassisches APM sagt dir, dass ein Request schnell war; es sagt dir nicht, dass die Antwort falsch war.
Wo es vorkommt
- RAG- und Agent-Apps: ein Nutzer-Turn fächert auf in Retrieval, mehrere LLM-Calls und Tool-Calls.
- Das Kosten-Dashboard — Token-Verbrauch pro Call, pro Nutzer, pro Feature.
- Eval-Pipelines, die Outputs in der CI und im Live-Traffic bewerten.
- Tools, die dir begegnen: LangSmith, Langfuse, Phoenix — meist auf OpenTelemetry aufgebaut.
Was es tut
Es macht das Innere eines nicht-deterministischen Systems einsehbar. Du kannst jede einzelne schlechte Antwort aufrufen, den exakten Prompt und Kontext nachspielen, der sie erzeugt hat, und sehen, wo in der Kette Zeit und Geld geflossen sind — und das über Millionen Anfragen aggregieren, um Trends und Regressionen zu erkennen.
Grüne Latenz und Uptime sagen, dass das System schnell ist — nicht, dass die Antworten stimmen. Eine Qualitäts-Regression fangen nur Evals.
Wie es funktioniert
Du instrumentierst jeden Aufruf in der Pipeline. Die Einheit ist ein Span (eine Operation — ein Retrieval, ein LLM-Call, ein Tool-Call); Spans verschachteln sich zu einem Trace für die ganze Anfrage. Auf jedem LLM-Span loggst du Modell, Input-Messages und Output sowie Metriken wie Input-/Output-Tokens, Kosten, Latenz (oft aufgeteilt in Time-to-First-Token und Gesamtzeit) und Fehlerrate. Die GenAI Semantic Conventions von OpenTelemetry standardisieren die Attribut-Namen — gen_ai.request.model, gen_ai.usage.input_tokens usw. — damit verschiedene Tools dieselbe Sprache sprechen.
Weil Outputs nicht-deterministisch sind, reichen Zeit und Kosten nicht — du brauchst auch Qualität. Die kommt aus Evals: Offline-Evals laufen vor dem Release mit einem fixen Datensatz gegen einen neuen Prompt oder ein neues Modell; Online-Evals bewerten eine Stichprobe des Live-Traffics. Scores stammen aus Regeln, einem LLM-as-Judge oder menschlicher Prüfung und stehen neben explizitem User-Feedback (Daumen hoch/runter, Edits, Retries). Der starke Move: den Loop schließen — Prod-Traces werden zum Eval-Set von morgen, das den nächsten Prompt schärft.
Worauf achten
- Prompts und Outputs sind Nutzerdaten. Sie wörtlich zu loggen kann PII oder Secrets erfassen — maskieren, redacten oder Einwilligung einholen, bevor du alles speicherst.
- "Sieht okay aus" ist eine Falle. Ohne Evals bleibt eine Qualitäts-Regression unsichtbar, bis Nutzer klagen; Latenz und Uptime können grün sein, während die Antworten still verrotten.
- Sampling vs. alles loggen. Volle Erfassung ist am nützlichsten und am teuersten — entscheide, was du samplest, besonders bei Online-Evals, die ein Modell erneut aufrufen.
- Jeder Modell- oder Prompt-Wechsel kann regressieren. Ein "besseres" Modell kann ein Format brechen, von dem dein Downstream-Code abhängt — Änderungen hinter einer Offline-Eval gaten.
- Definiere "gut", bevor du misst. Ein Judge oder eine Metrik, die du nicht verteidigen kannst, liefert selbstbewusst aussehendes Rauschen.